Background
Imagine you just hired a security guard to look after you and your family. The guard needs to learn about your family’s different members, your routine, your different assets, so they can keep an eye out for any suspicious activity.
The same goes for cybersecurity tools, albeit at an exponential scale. A team of professionals needs to define what suspicious behavior could look like within their environments, so tools like the one my product team and I worked on, can alert at the first sign of an anomaly.
These scenarios that define unusual behavior are referred to as rules throughout the industry. They follow an “if, then” logic. For example:
If an admin user accesses a database that holds sensitive information, at an odd time from an unusual location, create an alert.
Every single activity on each database is logged, and compared against these rules, looking for a match. These rules cover a wide variety of scenarios that apply to different areas of our client’s environments, creating a messy web of logic that has big repercussions if not untangled.
Primary User
Scott, the Data Security Admin
Jobs to be done
- Works with teammates to convert his company’s security needs into rules
- Sets up rules within the tool
- Monitors activity across his company’s database environment
- Generates reports on data activity
- Looks out for issues or ways to optimize his current set up; troubleshoots any known problems
Understanding the as-is scenario
To get a better understanding of the pain points of our users, my team and I had a look at the experience in our legacy product that our customers used at the time.

1. Understanding complex logic at a glance
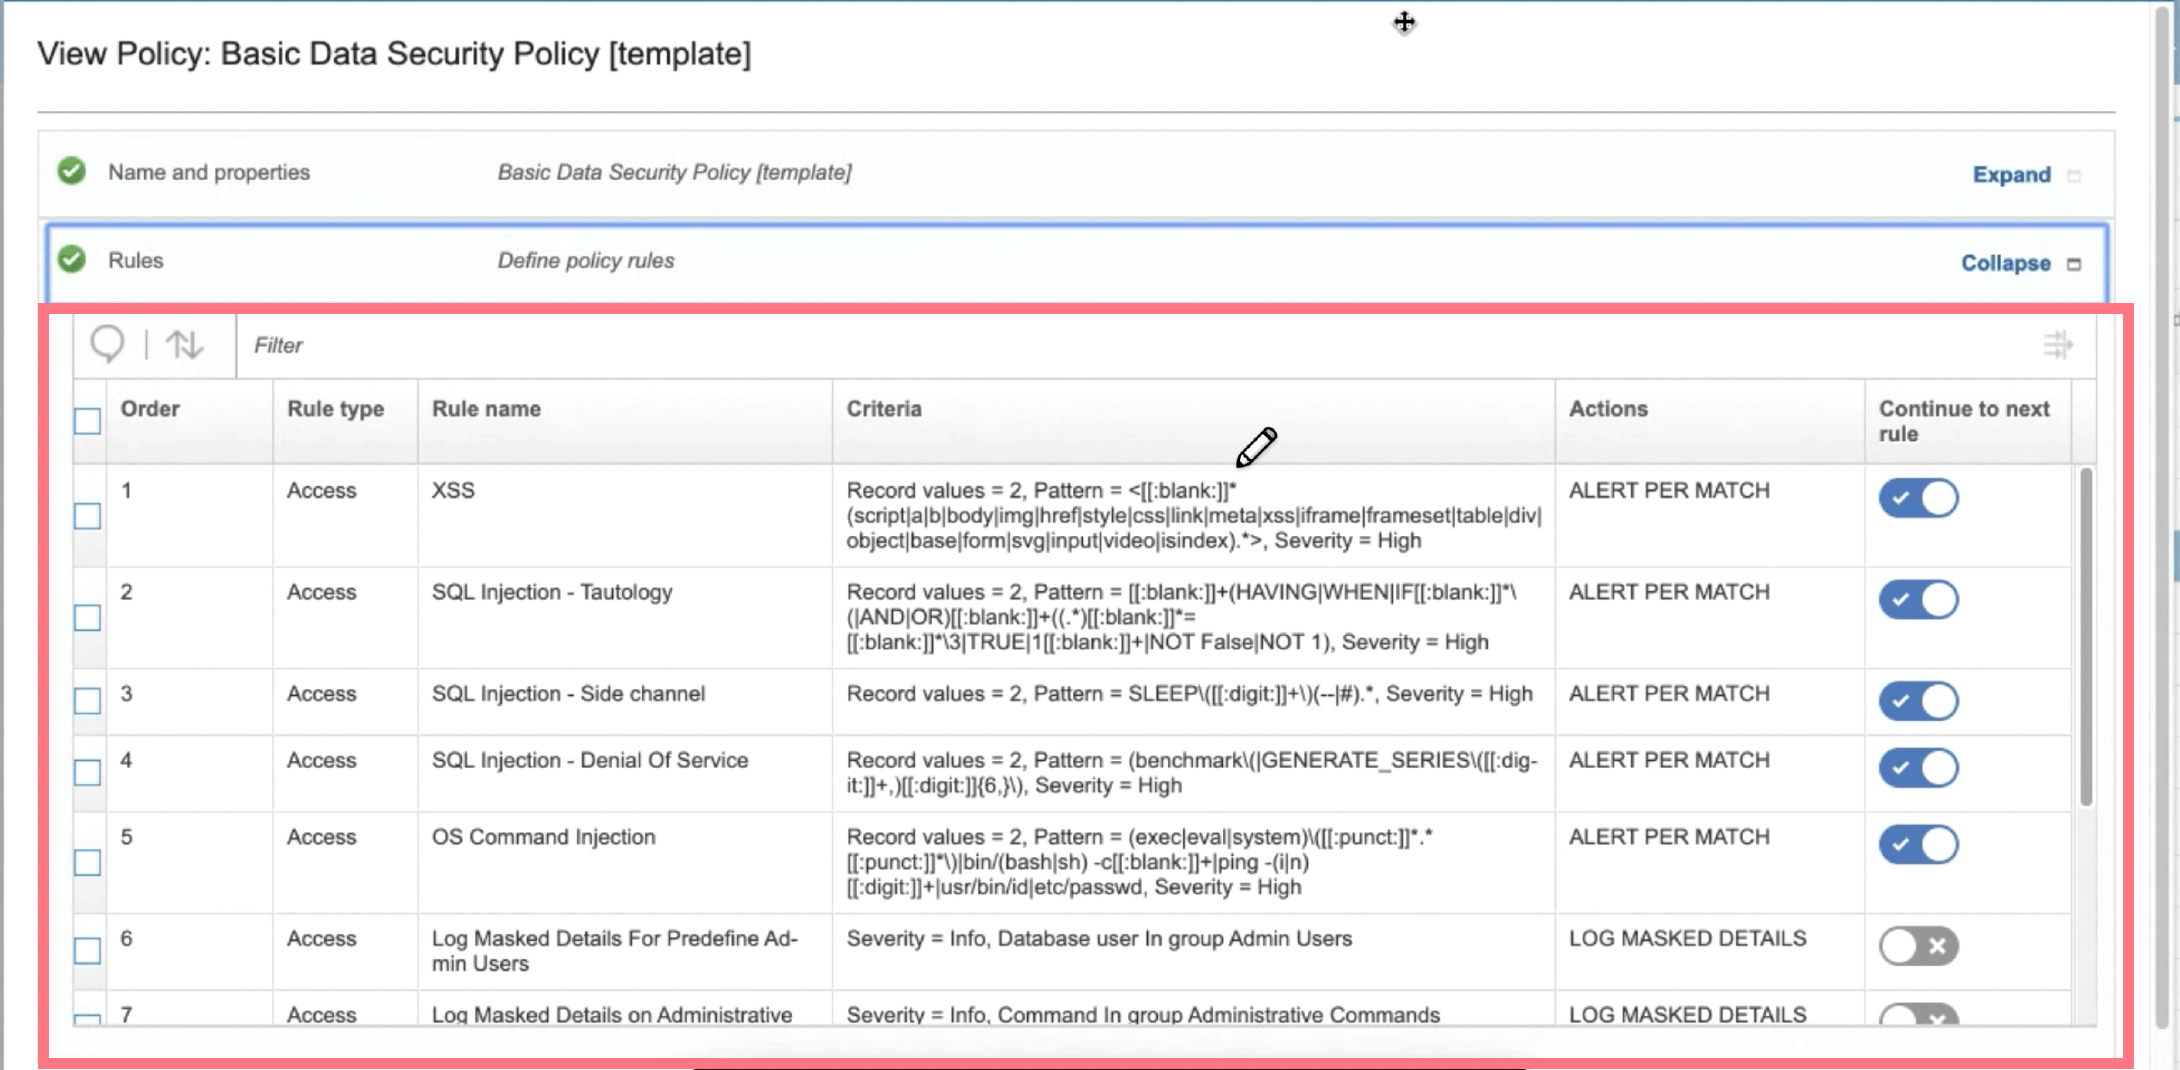
In order to do his job well, an admin need to have a firm grasp on what’s happening in their environment, and what rules are in place to protect it. However, in our legacy product, this complex logic was shown in a table, which is not a proper pattern for a step by step flow, where the ordering of rules matter, and the flow can be made to stop or continue. This leaves admins like Scott wondering questions like…
“How do I know if I’ve mapped this requirement correctly?”
“How do I troubleshoot if I’m not seeing the output I expected? How do I know which rule is the problem?”
“One rule keeps getting passed over. What’s the problem?”
2. High stress, high risk, high turnover
When my design team and I started working in this problem space, we were surprised to hear that users of our legacy product often complete trainings and certifications just to be able to use the product effectively. Some regularly attend user groups to troubleshoot their problems. And many have created “hacks” to make the product work for them. We heard during a user interviews that one mistake in this workflow could cost this particular user his job. With such an important, high-stakes task, users like Scott cannot afford to mess up. This stress often leads to high turnover. Unfortunately, those who stick with it are forced to become “experts” in the tool’s mysterious ways, or advocate to their CTOs to swap to a competitor, which takes time and money.
3. Storage and performance limitations
Not only does Scott need to get it right, he also needs to be minimize waste. Too many rules or too vague definitions could lead to more logging than necessary, which adds noise and makes it harder to root out the true alert, all while affecting performance and filling up valuable storage space. By now, you’re probably feeling pretty sorry for Scott. Rightfully so!
Need statement
Scott, a data security admin defining rules to monitor their environment, needs to understand the implications of their rule definitions so they can protect their environment without using unnecessary storage, slowing down their system, or missing any suspicious activity.
Project Scope
As part of this work, we could not alter the back-end technology in any way — it was simply about improving the communication of what already exists, and helping Scott with error prevention. We had limited access to our product manager and development team, as they were only part-time on this project, so we had to make a lot of assumptions and decisions ourselves as a design team. We also had limited access to users for feedback, so we had to be thrifty by leveraging preexisting research from related projects, and utilizing internal subject matter experts.
Explorations
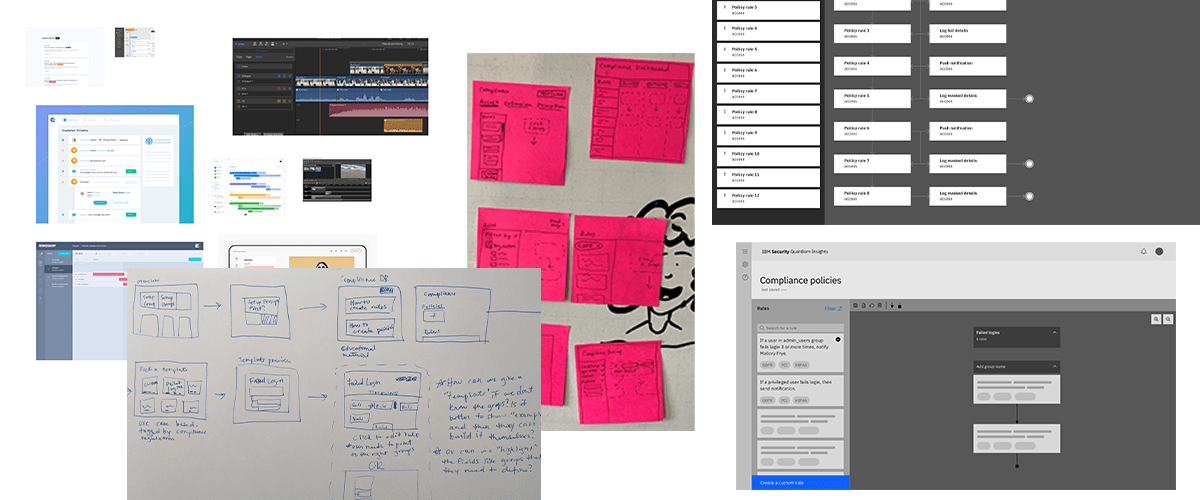
My team and I explored different ways to communicate the logic of rules. We got together for working sessions where we gathered and compared examples of visualizations with comparative logic outside of the cybersecurity industry.

We completed Crazy 8s exercises, which encouraged us to dream beyond the scope for a bit. We came up with some great ideas — a way to press play and preview your set of rules, a “mad-lib” approach that builds rules for you based on your specifications, or even simply improving the templates offered out of the box. Ultimately, due to the project scope and limitations, we chose to focus on improving the visualization of rules by exploring a flowchart based design.
Research
A/B Testing
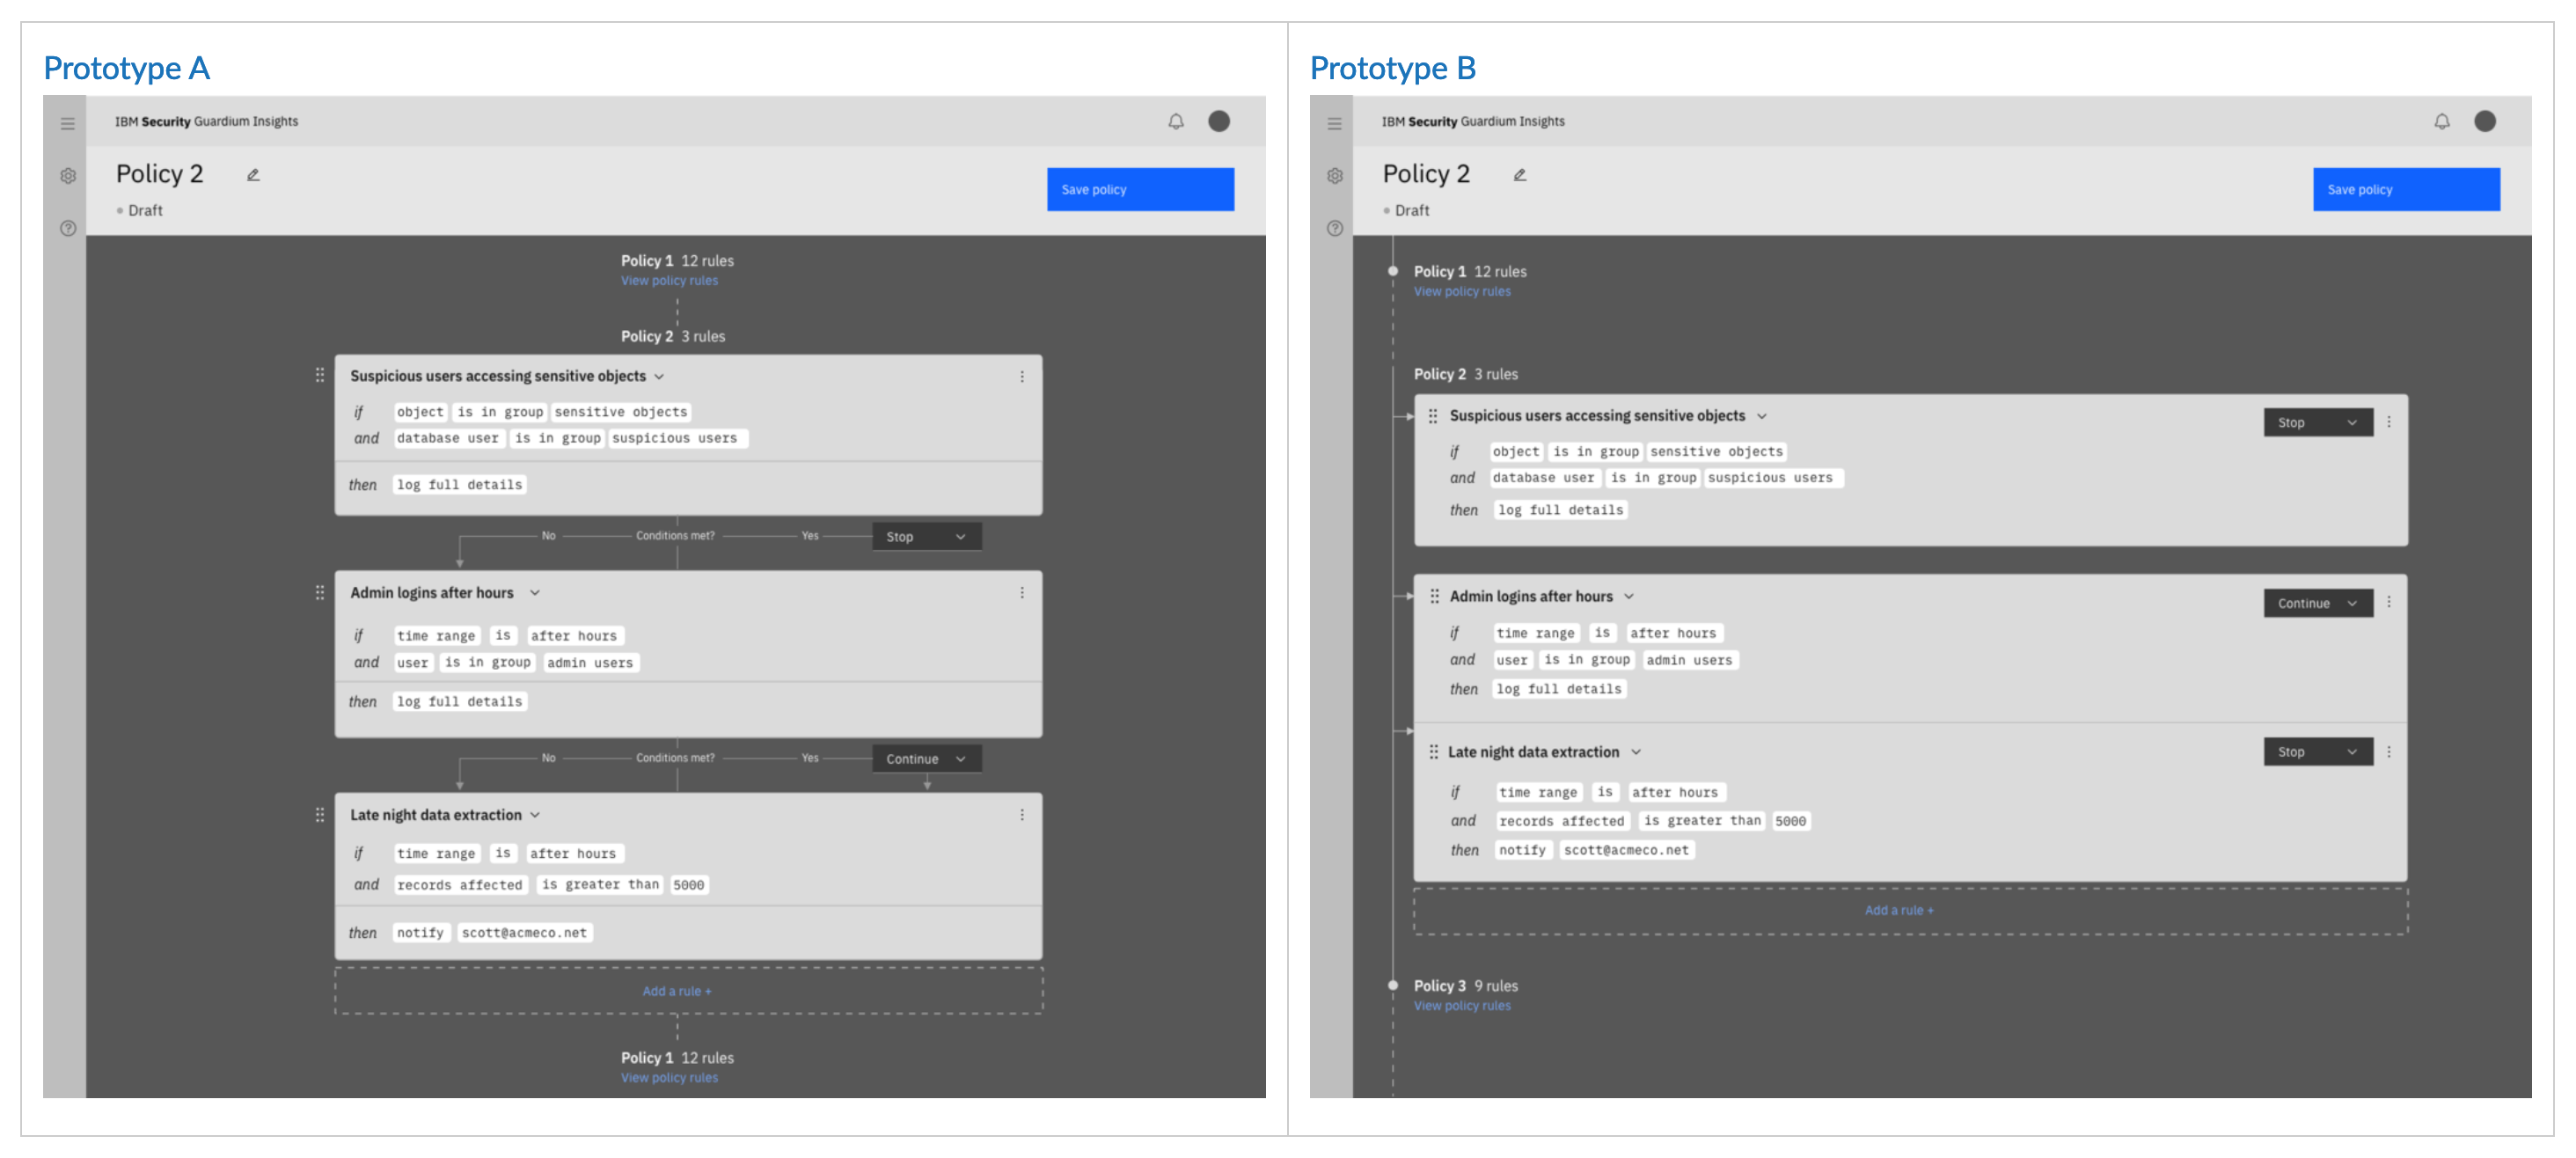
After exploring different flowchart designs and discussing feasability with the product team, we were at a crossroads and needed users to help us find the right path forward. I had created two variations of a flowchart visualization — one that relies on arrows and labels to communicate the flowing of information, and another that uses grouping and motion.

Because of our limited access to users for feedback, I decided to recruit some development managers from different squads to serve as proxy users. Since we were testing visual design of information, they didn’t need to be experts, but it certainly helped that they have a baseline knowledge of the industry and the user. I gave them two tasks and alternated which design they saw first.
- Describe how this collection of rules works.
- Change a rule from “stop” to “continue”. Explain the effect this had.
Results
The results were quite interesting. The majority of users preferred Option B, but they actually misinterpreted the design. Although Option A is less “elegant” visually, it was ultimately more successful — users made no mistake in interpreting it.
Delivery

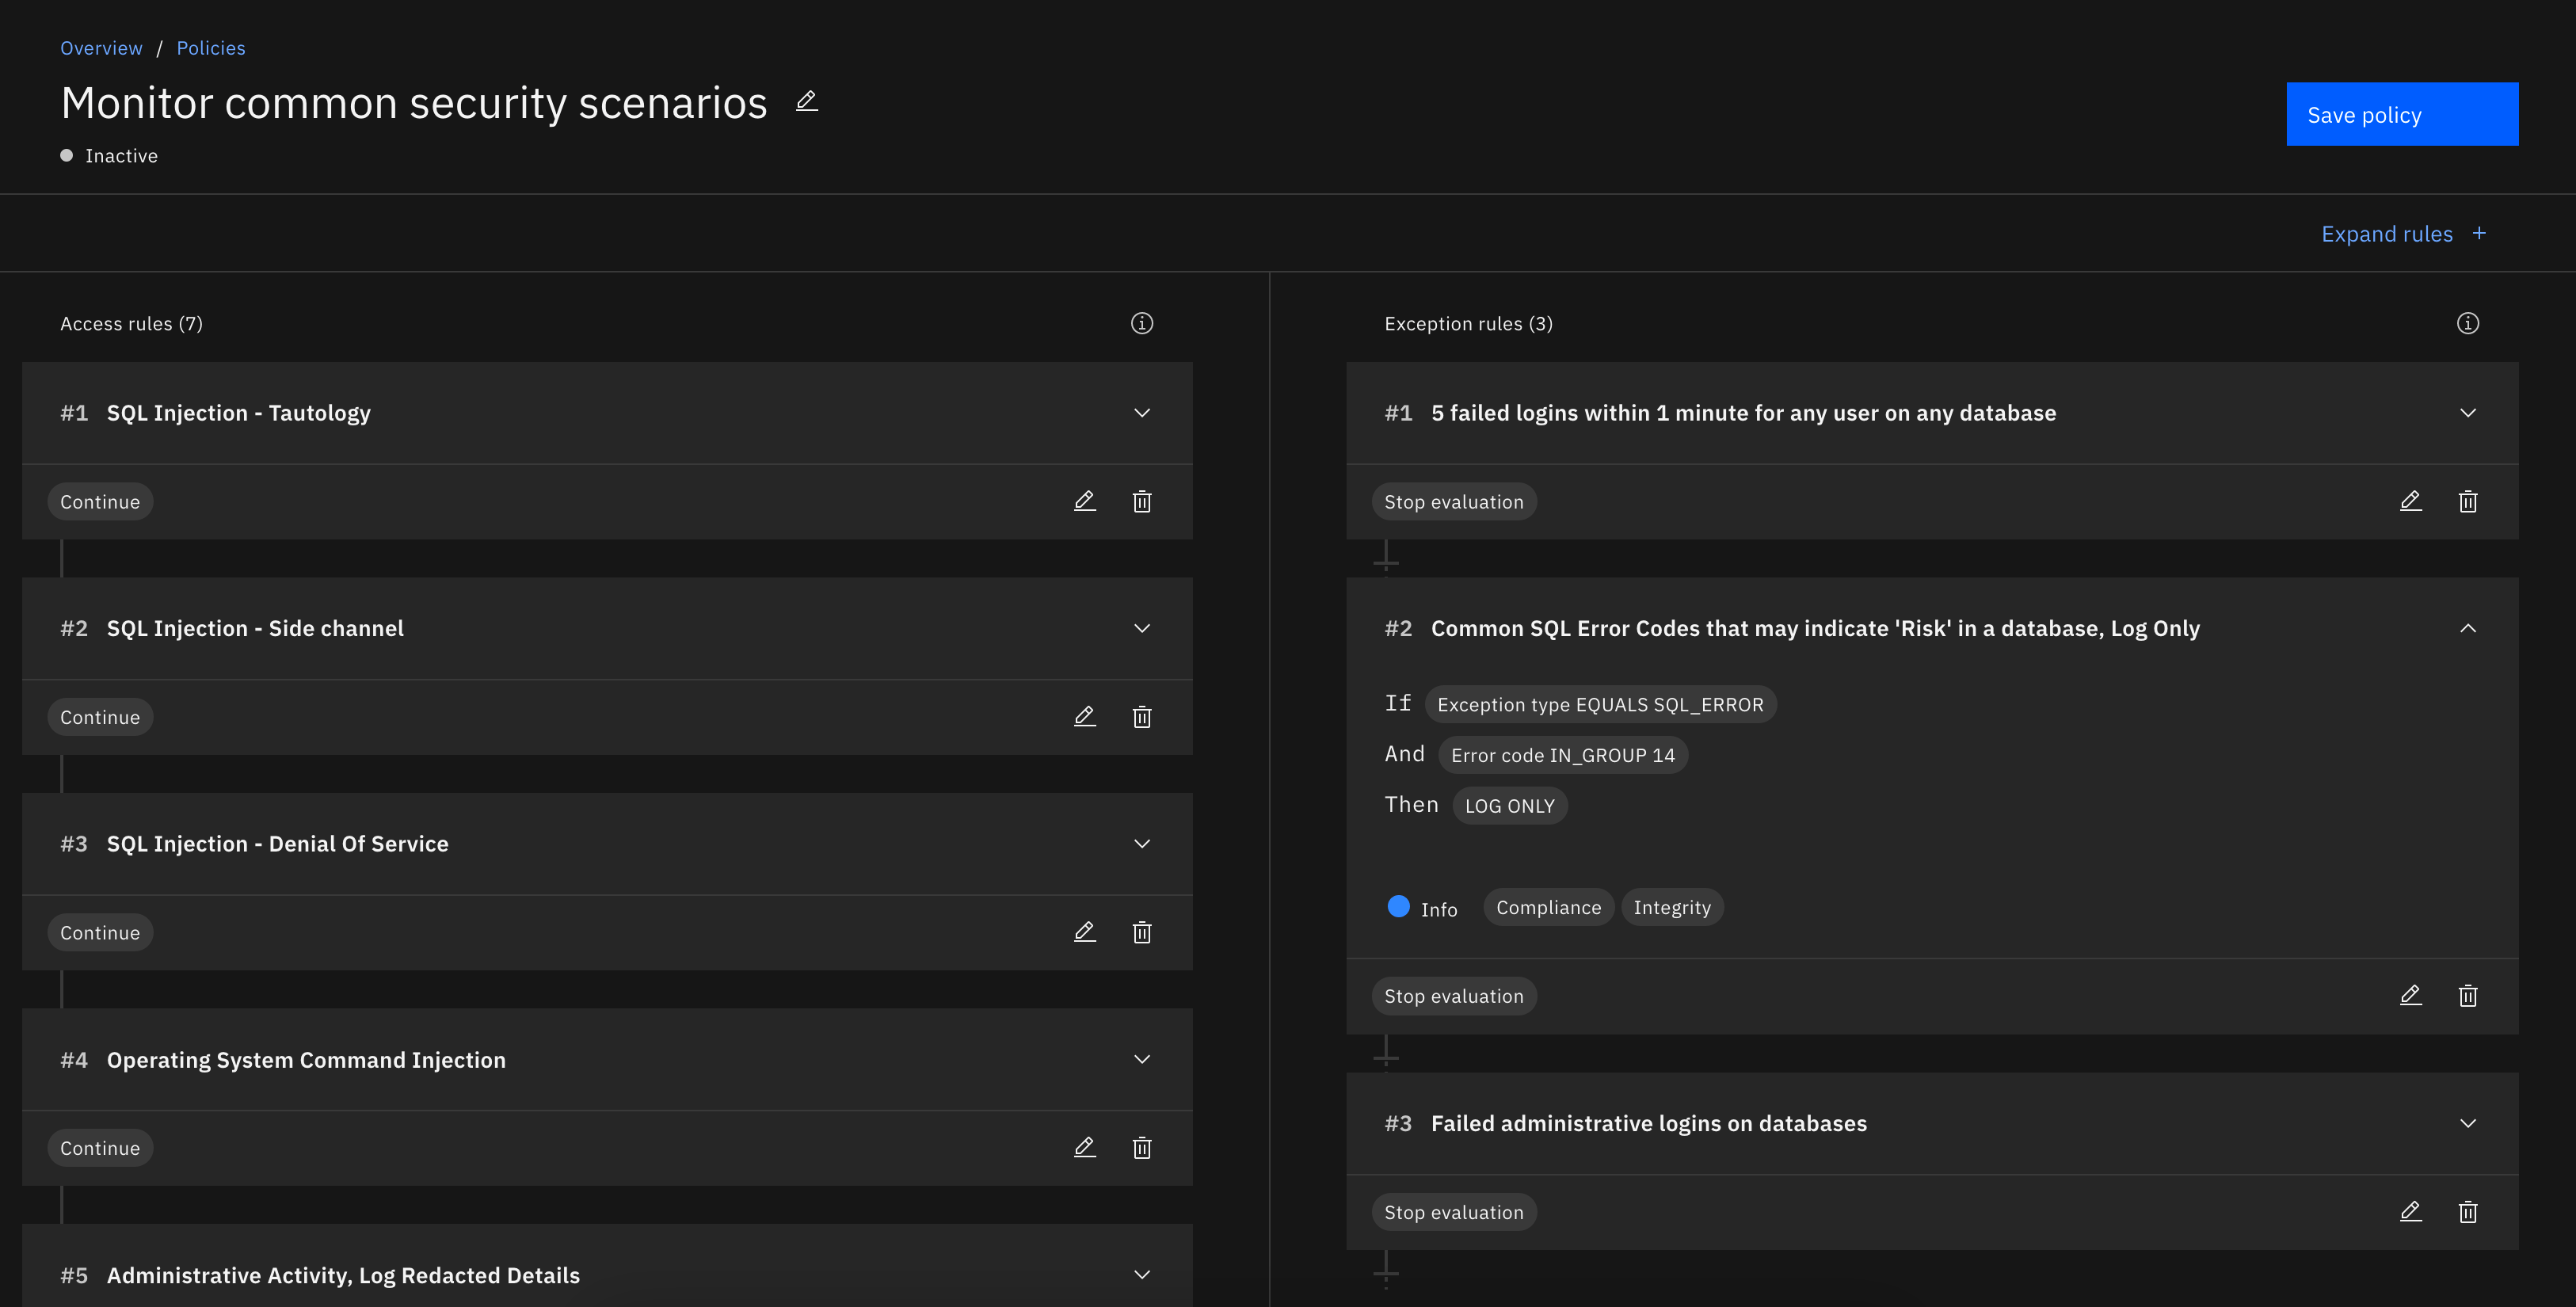
Usually, I see projects through to delivery, but for this particular project, I had other commitments to focus on, so a new designer on my squad took over. I continued to mentor this designer, by advising on visual design, giving feedback on alignment with our Carbon Design System and established IBM Security patterns.
By helping users like Scott understand the logic and implications of their rules, they could feel more confident during the initial set up to avoid common errors, and could collect the bare minimum amount of data needed to get the data needed.